Grafana
View as MarkdownGrafana is the dashboarding and query interface for the monitoring stack the Materialize Terraform modules install. This guide will help you deploy Grafana, with all data sources wired up to our template dashboards. This means you can start monitoring Materialize immediately.
If you are upgrading from a previous version of the Materialize Terraform Modules, read How to upgrade from previous versions first.
How it works
The dashboards read the two stores the monitoring stack runs: Thanos for metrics and Loki for logs. For how that data is collected, and where it is stored, see How logs and metrics are stored.
Installation
Before you begin
Ensure you have:
-
A Materialize deployment created with the Materialize Terraform modules.
-
Terraform ⧉ installed.
-
kubectl ⧉ installed and configured to connect to your cluster.
Step 1. Enable observability
The Materialize Terraform Modules take an enable_observability variable.
Starting with v12.0.0 it defaults to true, so a fresh apply installs the
monitoring stack without any configuration, and bumping ref=<tag> to v12.0.0
or later installs it on a deployment that never set the variable.
-
To confirm the setting, or to change it, set it explicitly in your
terraform.tfvars:enable_observability = true # default starting with Materialize Terraform Modules v12.0.0 -
Apply the configuration:
terraform applyThe apply creates the object storage and cloud identities for metrics and logs, and installs the stack into the
monitoringnamespace.
generic node pool
may need to grow before the first apply can schedule everything. If you do not
want it, set enable_observability = false before upgrading to Materialize
Terraform Modules v12.0.0.
Starting in v10.1.0, the examples also create two resources for Grafana
itself whenever enable_observability is on:
| Resource | Purpose |
|---|---|
| A dedicated PostgreSQL instance | Holds Grafana’s own state — users, service accounts and API tokens, annotations, dashboard versions, preferences, and alert-rule state. |
| An L4 load balancer | Reaches Grafana without port forwarding. Internal by default. |
Both are billable, and both are sized as small as the cloud offers
(db.t4g.micro on AWS, db-f1-micro on GCP, B_Standard_B1ms on Azure).
See Step 2 for the load balancer and Step
3 for the database.
If you instantiate the modules in your own Terraform rather than using an
example, add the monitoring module for your cloud (see the Terraform
installation guide
⧉),
and turn on the operator’s scrape annotations so its pods are collected:
module "operator" {
  # ...
  helm_values = {
    observability = {
      enabled = true
      prometheus = {
        scrapeAnnotations = {
          enabled = true
        }
      }
    }
  }
}
Step 2. Access Grafana
Retrieve the admin password from the Terraform output. You need it for either
access method below:
terraform output -raw grafana_admin_password
%) because the output did not
end with a newline. Do not include the marker when using the value.
Through the load balancer
Starting in v10.1.0, the examples put Grafana behind an L4 load balancer. It
follows the same internal_load_balancer and ingress_cidr_blocks variables as
the Materialize load balancer, so by default it is internal and allowlisted
to the same ranges.
-
Read the address:
terraform output -raw grafana_urlgrafana_urlis the hostname you supplied, else the load balancer’s own address, else the in-cluster Service.grafana_load_balancer_addressgives you just the load balancer.NOTE: On GCP and Azure the cloud assigns the address asynchronously, so a fresh apply can still report the in-cluster name. The next plan picks it up. Setipongrafana_load_balancerto pre-allocate the address and have it known at plan time. -
Open the address in a browser and log in as
admin.
The load balancer terminates no TLS, and Grafana has no identity provider until you configure one — so the generated admin password is the whole of the access control, sent over plain HTTP. Keep the load balancer internal until both are addressed.
Every datasource behind Grafana reads every metric in Thanos and every log in
the tenant. A public load balancer whose allowlist is still 0.0.0.0/0 is
refused at plan time for Grafana specifically.
security.cookie_secure while Grafana is served over plain HTTP. It
marks the session cookie Secure, the browser then stops sending it over the
connection that works, and login breaks entirely.
To make Grafana’s own share links, alert notification links, and OAuth redirect
URIs correct, set grafana_host to a hostname you control. Nothing in the
modules publishes DNS for that name — that record is yours to create.
To skip the load balancer entirely and keep Grafana on a ClusterIP Service,
set grafana_load_balancer = null on the monitoring module block.
Through port forwarding
Port forwarding stays the private path, and is the only option when the load balancer is internal and you are outside the network.
-
Forward a local port to the Grafana service:
kubectl -n monitoring port-forward svc/grafana 3000:80 -
Open http://localhost:3000 in a browser and log in as
adminwith the password from above.
Step 3. Persist Grafana’s own state
Grafana keeps users, service accounts and API tokens, annotations, dashboard versions, preferences, and alert-rule state in its own database — separate from the metrics in Thanos and the logs in Loki.
The chart default is SQLite on an emptyDir, so all of it is lost on every
restart, upgrade, and reschedule. Starting in v10.1.0 the examples provision a
dedicated PostgreSQL instance for it instead, whenever enable_observability is
on. Confirm it:
terraform output -raw grafana_database_endpoint
To keep the previous SQLite behaviour, set grafana_database = null on the
monitoring module block. To point at a database you already run, leave
grafana_database = null and set the grafana_database_host,
grafana_database_port, grafana_database_name, grafana_database_user,
grafana_database_password, and grafana_database_ssl_mode variables instead.
Step 4. Open the Materialize dashboards
The dashboards and their data sources are installed by Grafana Operator from the released chart, so they track the chart version rather than a copy you maintain.
To confirm that they were installed:
kubectl -n monitoring get grafanamanifest,grafanadatasource
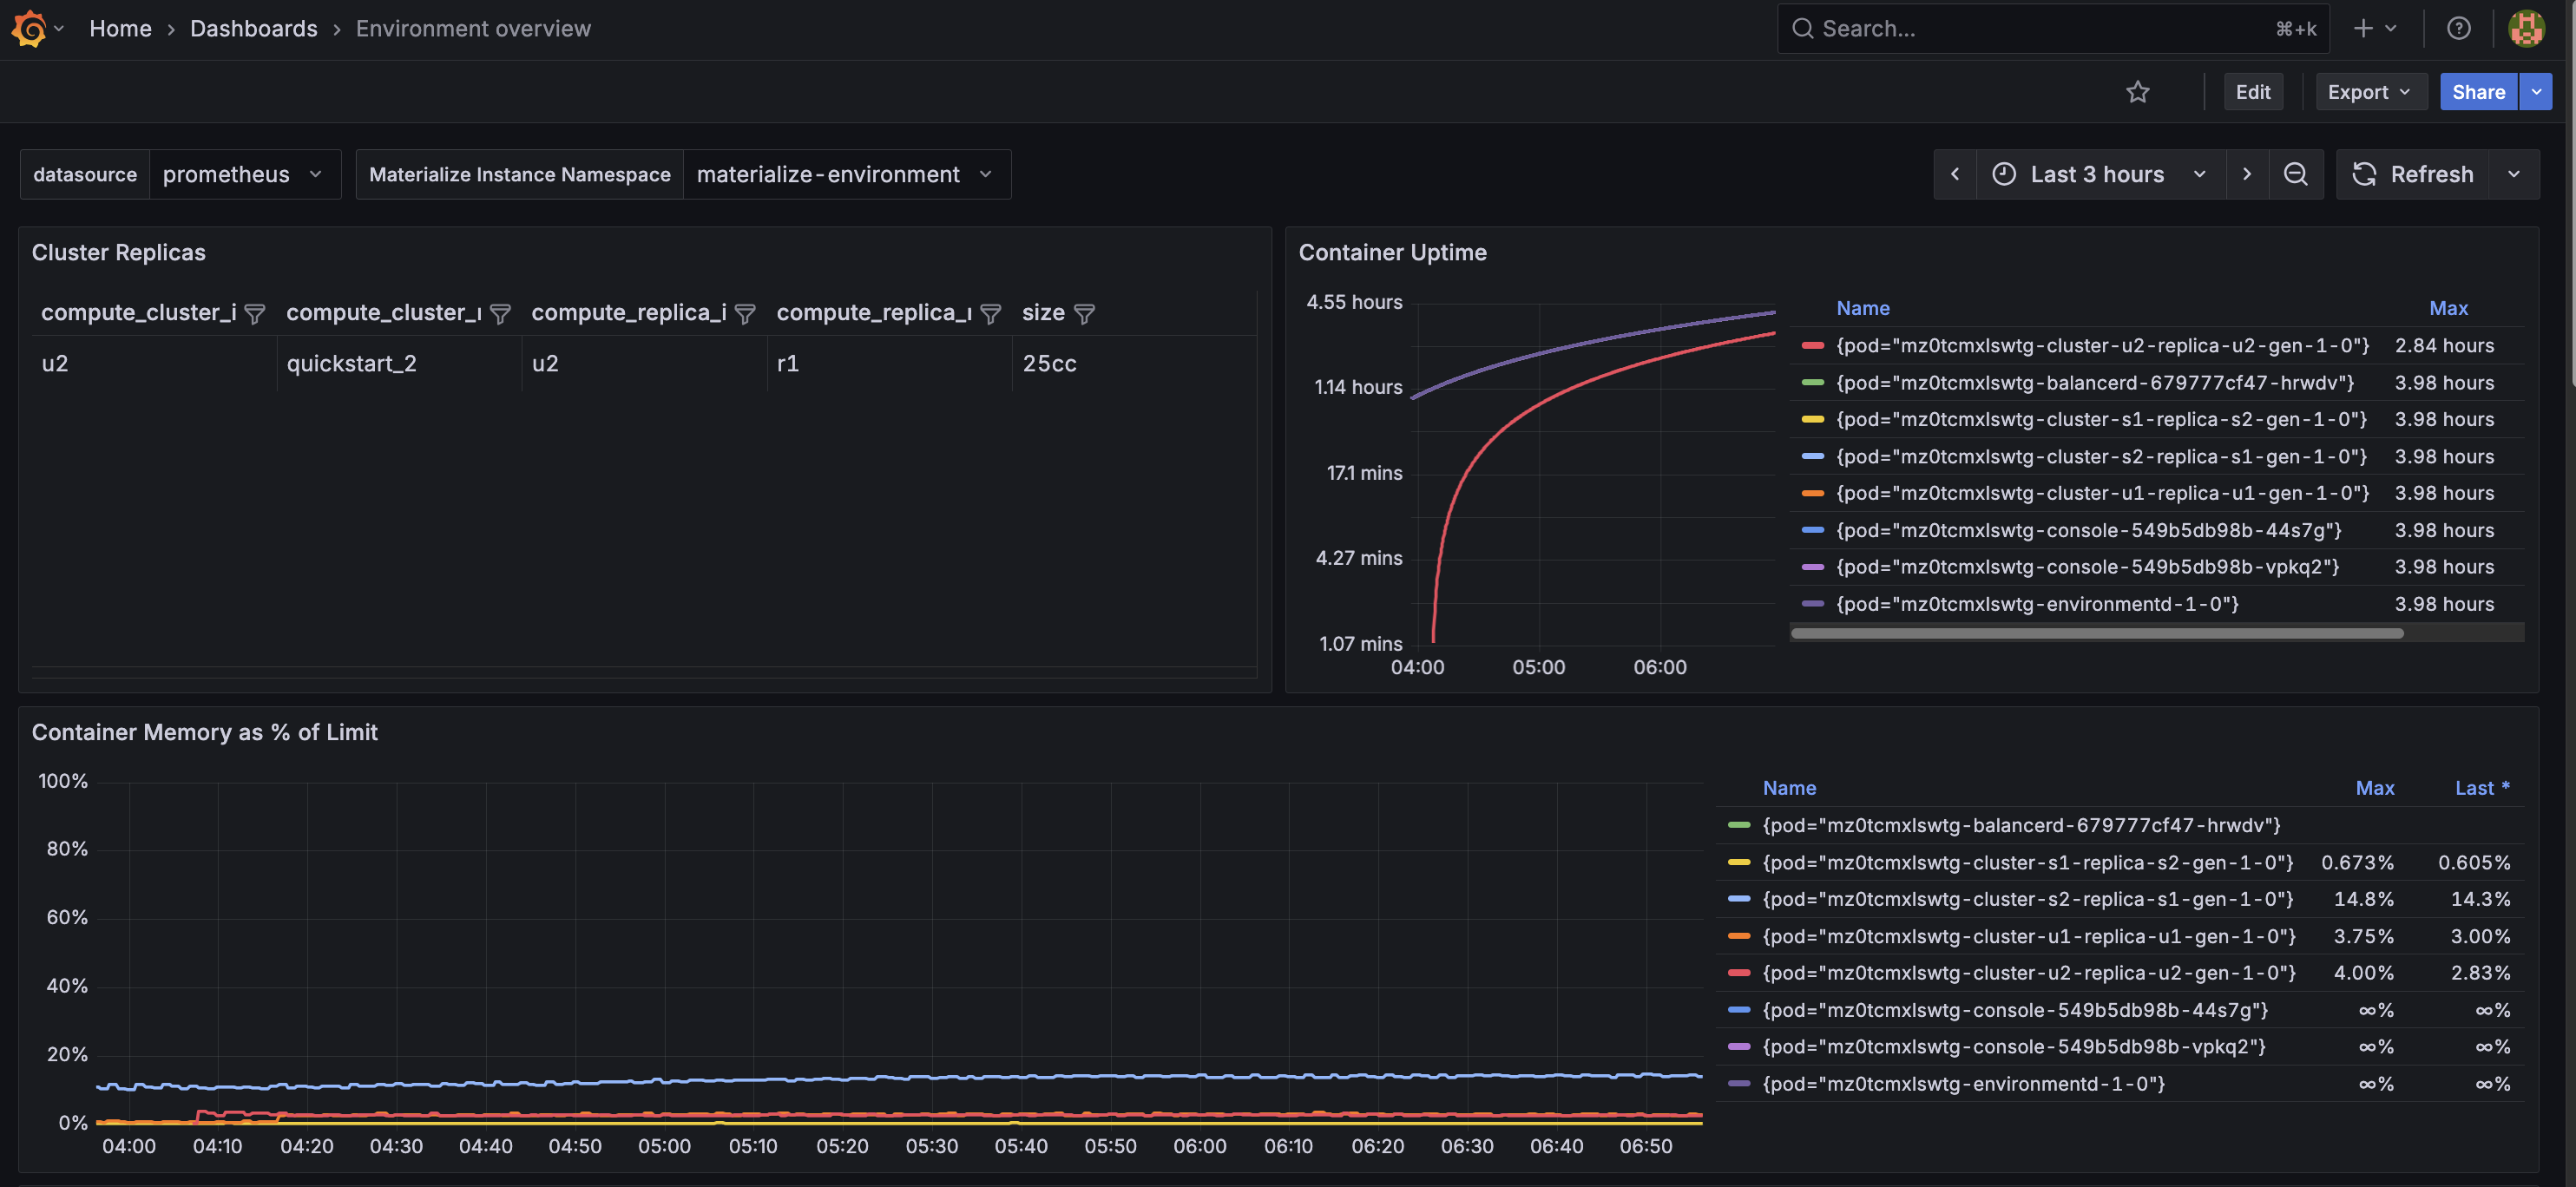
For the list of dashboards and what each one covers, see Grafana dashboards ⧉.
How to upgrade from previous versions of the Materialize Terraform Modules
Before Terraform v10.0.0, enable_observability = true installed a single Prometheus
and a Grafana from kubernetes/modules/prometheus and
kubernetes/modules/grafana. Those two modules were removed in v10.0.0 —
not deprecated in place — and replaced by a monitoring module per cloud.
prometheus and grafana Helm
releases and their PersistentVolumeClaims. Up to 15 days of local Prometheus
data goes with them: there is no backfill, and the new stack begins collecting
at install. Anything hand-created in the old Grafana — dashboards, users, saved
queries — does not carry over either.
Other things that change on that upgrade:
-
If you referenced
kubernetes/modules/prometheusorkubernetes/modules/grafanadirectly rather than through an example, that reference breaks. Pin the previous major until you have migrated to themonitoringmodule for your cloud. -
The
prometheus_urloutput is gone, replaced bymetrics_url(Thanos Query) andlogs_url(Loki). Thanos Query is Prometheus-API-compatible, so consumers of the old URL work against the new one — only the host and port change. -
grafana_urlandgrafana_admin_passwordkeep their names and meaning. -
New cloud resources are created: object storage for each backend (logs and metrics), plus a per-backend cloud identity bound to the in-cluster ServiceAccount.
-
If you set
install_metrics_server = falseon the operator module, setinstall_metrics_server = trueon the monitoring module in the same change. The Materialize Console depends on the metrics API for cluster metrics.
For the per-cloud module blocks and the full upgrade procedure, see the upgrade guide for your cloud: AWS, Azure, or GCP.
Connect existing tooling
If you already run Grafana, or another tool that should read the collected data, the examples publish the query endpoints for both stores as Terraform outputs. See How logs and metrics are stored.
To have the stack push its metrics or logs to a platform you already run rather than being queried, see the destinations listed in How logs and metrics are stored.
Advanced configuration
The monitoring modules expose additional options, including sizing profiles, retention, node placement, and raw Helm value overrides. For these, and for installing the stack without the Materialize Terraform modules, see:
-
Terraform installation guide ⧉, for the full set of module variables.
-
Helm installation guide ⧉, for installing the stack with Helm rather than Terraform.
-
Production best practices ⧉, for the throughput envelope each sizing profile assumes and what to scale when metric/logging queries feel slow.
Alerting
The stack includes Alertmanager for recording and routing alerts. For guidance on the initial set of metrics and suggested thresholds, see Alerting.