Grafana
View as MarkdownThe Materialize Terraform modules can deploy a monitoring stack alongside your Materialize deployment. Enabling it installs:
| Component | Purpose |
|---|---|
| Grafana | Dashboards and query UI, with the Materialize dashboards pre-installed. |
| Thanos | Metrics storage backed by object storage, with a Prometheus-compatible query endpoint. |
| Loki | Log storage backed by object storage. |
| Grafana Alloy | Collection of metrics and logs from Materialize and from the cluster. |
| Alertmanager | Alert routing. |
The stack comes from the materialize-monitoring
⧉ charts. The
Terraform modules also create the object storage and the cloud identities the
stack needs, so you do not have to configure scrape targets, data sources, or
dashboards yourself.
Before you begin
Ensure you have:
-
A Materialize deployment created with the Materialize Terraform modules.
-
Terraform ⧉ installed.
-
kubectl ⧉ installed and configured to connect to your cluster.
Step 1. Enable observability
The simple and enterprise examples for each cloud take an
enable_observability variable, which defaults to false in simple and
true in enterprise.
-
In your
terraform.tfvars, set:enable_observability = true -
Apply the configuration:
terraform applyThe apply creates the object storage and cloud identities for metrics and logs, and installs the stack into the
monitoringnamespace.
If you instantiate the modules in your own Terraform rather than using an
example, add the monitoring module for your cloud (see the Terraform
installation guide
⧉),
and turn on the operator’s scrape annotations so its pods are collected:
module "operator" {
  # ...
  helm_values = {
    observability = {
      enabled = true
      prometheus = {
        scrapeAnnotations = {
          enabled = true
        }
      }
    }
  }
}
Step 2. Access Grafana
Grafana is deployed as a ClusterIP service in the monitoring namespace, so
reaching it means port forwarding.
-
Retrieve the
adminpassword from the Terraform output:terraform output -raw grafana_admin_password💡 Tip: Your shell may show an ending marker (such as%) because the output did not end with a newline. Do not include the marker when using the value. -
Forward a local port to the Grafana service:
kubectl -n monitoring port-forward svc/grafana 3000:80WARNING! Port forwarding is for testing purposes only. For production environments, expose Grafana through your own ingress and configure authentication for it. -
Open http://localhost:3000 in a browser and log in as
adminwith the password from the first step.
Step 3. Open the Materialize dashboards
The dashboards and their data sources are installed by grafana-operator from the released chart, so they track the chart version rather than a copy you maintain.
To confirm they landed:
kubectl -n monitoring get grafanamanifest,grafanadatasource
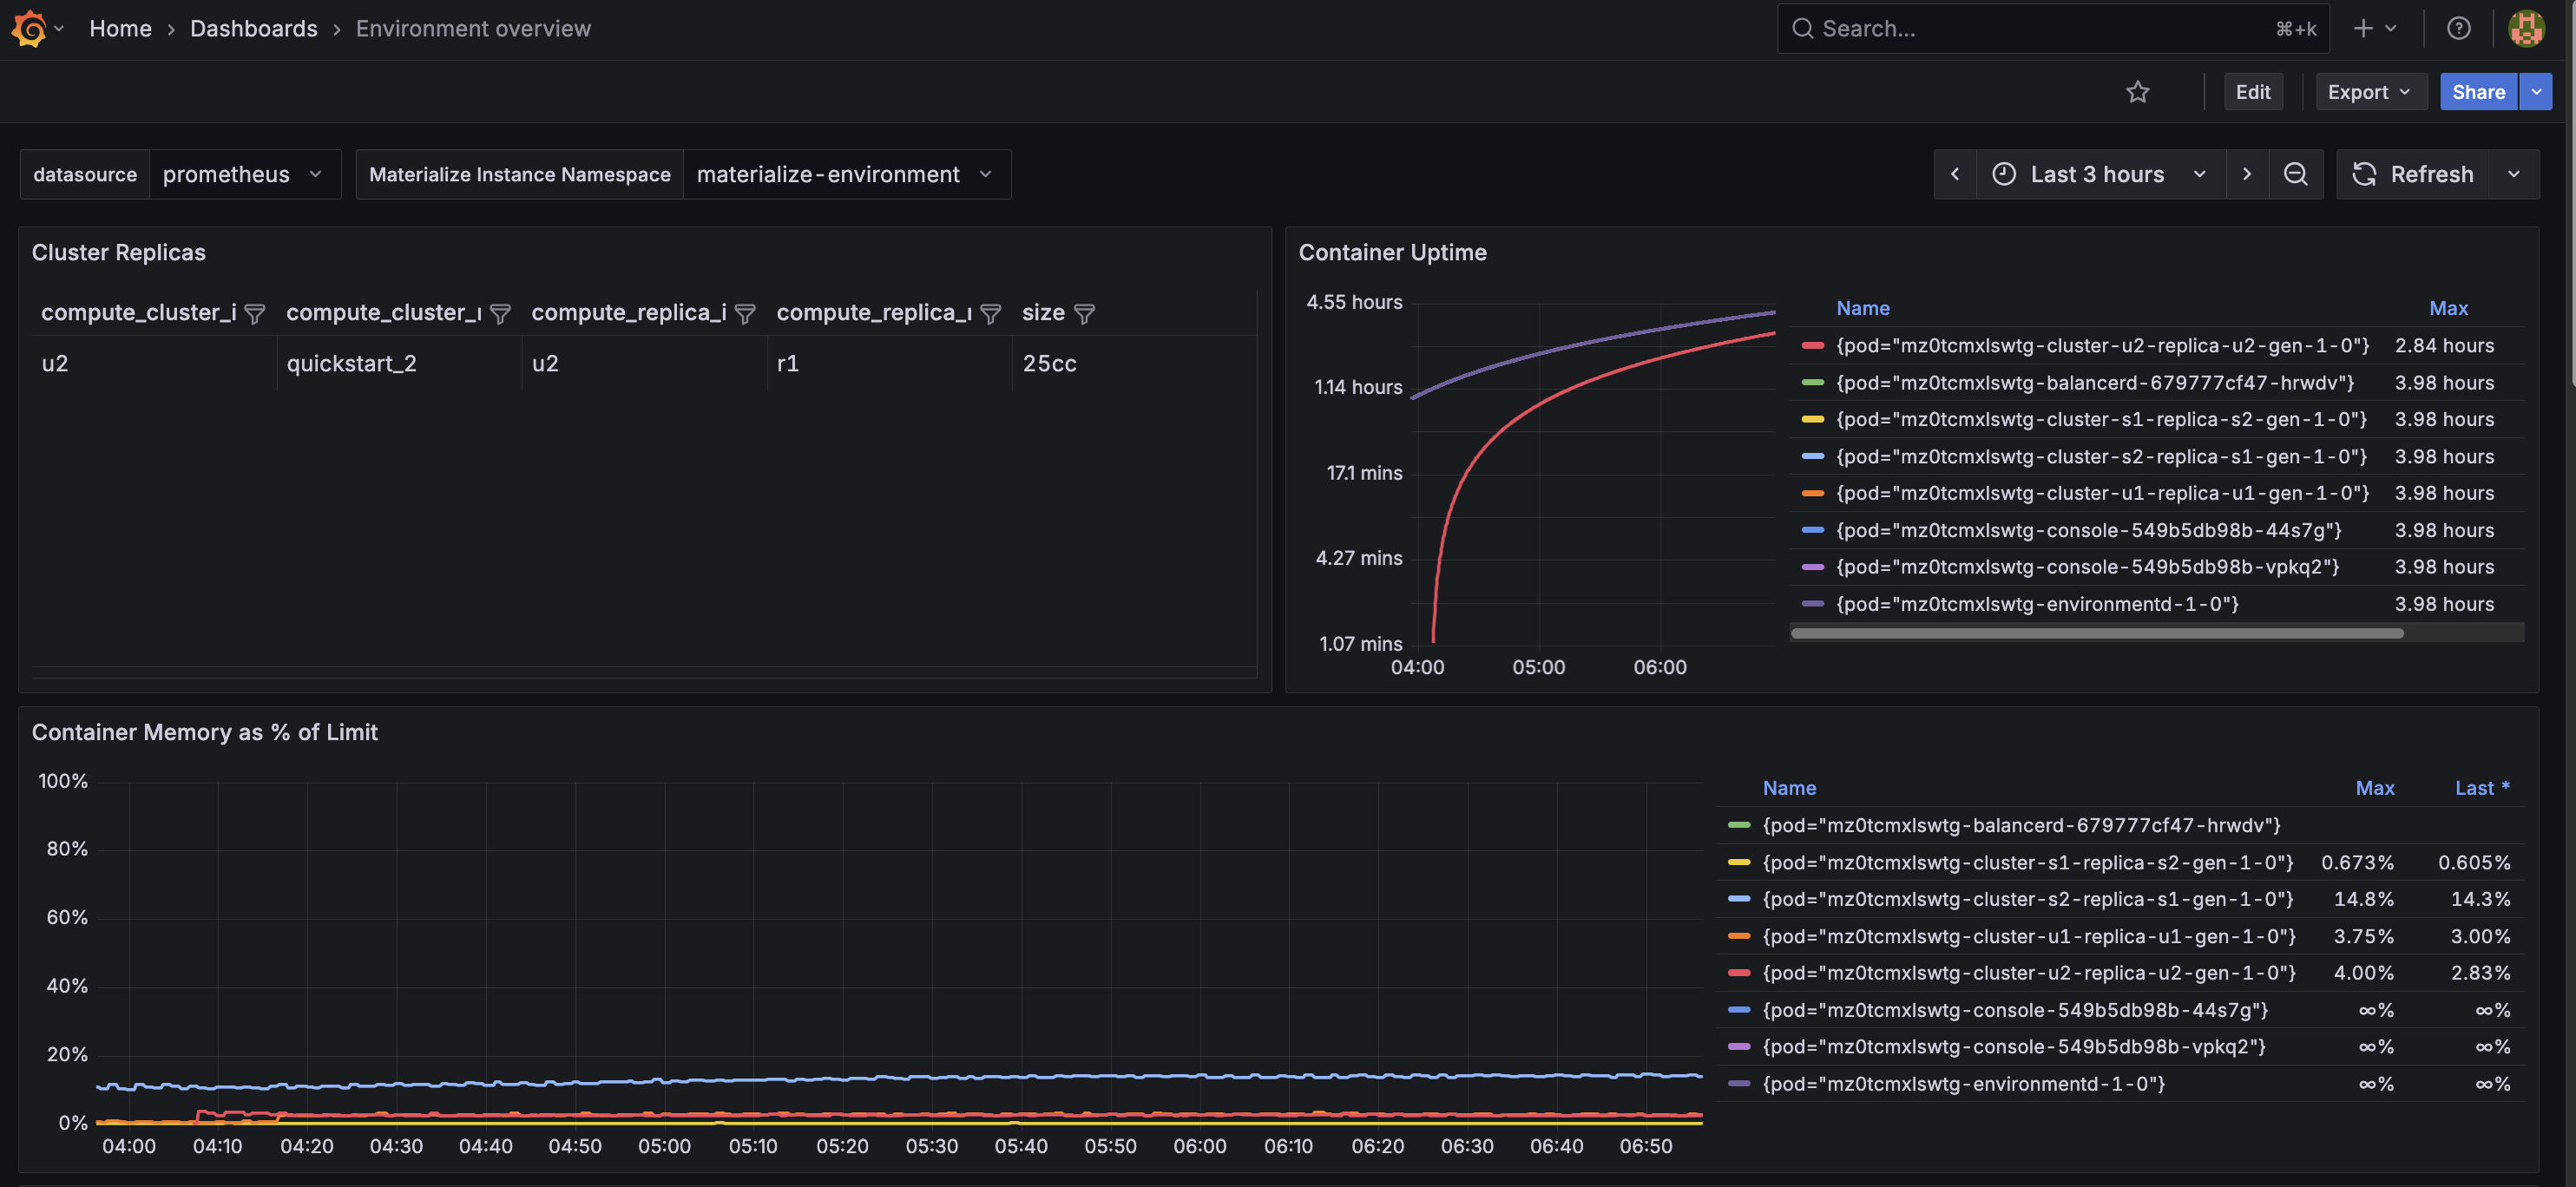
For the list of dashboards and what each one covers, see Grafana dashboards ⧉.
Connect existing tooling
If you already run Grafana, or want to point other tools at the collected data, the examples output the query endpoints:
| Output | Endpoint |
|---|---|
metrics_url |
Thanos Query. Prometheus-API-compatible, so anything that speaks to a Prometheus server works against it. |
logs_url |
Loki read endpoint. |
terraform output -raw metrics_url
Advanced configuration
The monitoring modules expose further options, including sizing profiles, retention, node placement, and raw Helm value overrides. For these, and for installing the stack without the Materialize Terraform modules, see:
-
Terraform installation guide ⧉, for the full set of module variables.
-
Helm installation guide ⧉, for installing the stack with Helm rather than Terraform.
-
Production best practices ⧉, for the throughput envelope each sizing profile assumes and what to scale when metric/logging queries feel slow.
Alerting
The stack includes Alertmanager. For the metrics and thresholds to start from, see Alerting.