# Clusters
Guidance for configuring and operating Materialize clusters.
Clusters provide the compute resources for running dataflows in Materialize.
- Learn about [clusters](/fundamentals/concepts/clusters/).
- Follow the [operational guidelines](/clusters/operational-guidelines/).
- Learn how to [optimize cluster size](/clusters/sizing/).
- [Optimize hydration requirements](/clusters/optimize-hydration-requirements/).
- Speed up hydration with [autoscaling](/clusters/autoscaling/).
- Understand [system clusters](/clusters/system-clusters/).
- [Troubleshoot anomalies in CPU usage](/clusters/cpu-troubleshooting/).
---
## Autoscaling for hydration
> **Public Preview:** This feature is in public preview.
When you create an index, materialized view, or Kafka upsert source, or when a
cluster restarts, the cluster must
[hydrate](/fundamentals/concepts/hydration/) the affected
objects before they can serve results. Hydration reads the input data
and rebuilds in-memory state, and its speed scales with the cluster
[size](/sql/create-cluster/#available-sizes).
The `AUTO SCALING STRATEGY (ON HYDRATION)` option lets a cluster **automatically
provision an extra burst replica at the configured `HYDRATION SIZE` while it has
un-hydrated objects**. This speeds up hydration without manually scaling the
cluster up before hydration and back down afterward. The steady-size replicas
continue hydrating in parallel, and once one of them catches up with the burst,
the burst replica lingers for the `LINGER DURATION` and is then removed. The
burst replica is an ordinary cluster replica, billed only for the time it is
provisioned. See [Usage & billing](/materialize-cloud/billing/) for details.
`AUTO SCALING STRATEGY (ON HYDRATION)` is particularly useful for [blue/green
deployments](/manage/blue-green/), where a new cluster must hydrate before the
cutover. It is only available on **managed clusters**, and cannot be combined
with a cluster `SCHEDULE` other than the default `MANUAL`.
For example, the following cluster can provision a burst replica of size `800cc`:
```mzsql
CREATE CLUSTER fast_start (
SIZE = '100cc',
AUTO SCALING STRATEGY = (
ON HYDRATION (
HYDRATION SIZE = '800cc',
LINGER DURATION = '15s'
)
)
);
```
You can specify the following options:
Option | Description
-------|------------
`HYDRATION SIZE` | The [size](/sql/create-cluster/#available-sizes) of the burst replica provisioned while the cluster has un-hydrated objects. Must differ from the cluster's steady `SIZE`. Choose a larger size to speed up hydration.
`LINGER DURATION` | Optional. How long the burst replica lingers after a steady-size replica catches up, before it is removed. Default: `0s`.
Provisioning the burst replica requires enough compute capacity to run it. In
Materialize Self-Managed, this means your Kubernetes cluster must have enough
spare resources (for example, available nodes) to schedule the burst replica.
The burst is best-effort and never blocks the cluster: if the burst replica
cannot be provisioned, the steady-size replicas still come up and hydrate as
usual, as long as there are enough resources for them.
To remove the autoscaling strategy from a cluster, use `ALTER CLUSTER ... RESET
(AUTO SCALING STRATEGY)` or set an empty strategy with `AUTO SCALING STRATEGY =
()`.
You can inspect the configured strategy and any in-flight burst in the
[`mz_internal.mz_cluster_auto_scaling_strategies`](/sql/system-catalog/mz_internal/#mz_cluster_auto_scaling_strategies)
catalog view.
## Configure autoscaling on an existing cluster
You can also add, change, or remove the strategy after the cluster already
exists:
```mzsql
ALTER CLUSTER fast_start SET (
AUTO SCALING STRATEGY = (
ON HYDRATION (HYDRATION SIZE = '800cc', LINGER DURATION = '15s')
)
);
```
```mzsql
ALTER CLUSTER fast_start RESET (AUTO SCALING STRATEGY);
```
For the full option reference, see the `AUTO SCALING STRATEGY` option on
[`CREATE CLUSTER`](/sql/create-cluster/#autoscaling) and
[`ALTER CLUSTER`](/sql/alter-cluster/#speed-up-hydration-by-autoscaling-to-a-larger-size).
## Monitor an autoscaling event
To check whether a burst is currently running and what it's configured to do,
query
[`mz_internal.mz_cluster_auto_scaling_strategies`](/sql/system-catalog/mz_internal/#mz_cluster_auto_scaling_strategies):
```mzsql
SELECT
c.name AS cluster,
s.strategy->'on_hydration'->>'hydration_size' AS hydration_size,
s.state->'burst'->>'burst_size' AS inflight_burst_size
FROM mz_internal.mz_cluster_auto_scaling_strategies AS s
JOIN mz_clusters AS c ON c.id = s.cluster_id;
```
`inflight_burst_size` is `NULL` when no burst is running, and reports the burst
replica's size while one is up. [`SHOW CLUSTERS`](/sql/show-clusters/) also
summarizes an in-flight burst in its `activity` column, and lists the burst
replica itself, at its larger size, in `replicas`:
```nofmt
name | replicas | activity
-------------+------------------------+-----------------------------
fast_start | r1 (100cc), r2 (800cc) | hydration burst at 800cc
```
To check whether the objects driving the burst have finished hydrating on the
steady-size replicas, query
[`mz_internal.mz_hydration_statuses`](/sql/system-catalog/mz_internal/#mz_hydration_statuses)
for the cluster's steady-size replica IDs. Once every object is hydrated on a
steady-size replica, the burst replica lingers for the configured `LINGER
DURATION` and is then removed.
The [audit log](/sql/system-catalog/mz_catalog/#mz_audit_events) records when a
burst replica is created and dropped, so you can look back at past autoscaling
events after the fact.
## If the steady-size replica never hydrates
The burst replica has no maximum lifetime: if a steady-size replica never
catches up (for example, it's undersized and runs out of memory during
hydration), the burst replica keeps serving indefinitely at the configured
`HYDRATION SIZE`, billed for as long as it runs. This is deliberate: the burst
replica may be the only thing keeping the cluster able to serve results, so
Materialize does not tear it down just because it has been up a while.
If you find yourself in this situation, [resize the cluster](/sql/alter-cluster/#resizing)
to a `SIZE` that can hydrate the objects at steady state. The burst replica
keeps serving throughout the resize, so there's no gap in availability while
you find the right size.
## If capacity is unavailable
Provisioning the burst replica requires enough compute capacity to run it. In
**Materialize Self-Managed**, this means your Kubernetes cluster needs enough
spare resources (for example, available nodes) to schedule the burst replica's
pods. If it doesn't, Materialize keeps retrying automatically; no action is
required on your part, though the burst can't speed up hydration until
capacity frees up.
Either way, the burst is best-effort and never blocks the cluster: the
steady-size replicas come up and hydrate as usual, independently of whether the
burst replica could be provisioned, as long as there are enough resources for
them. If you plan to lean on autoscaling for hydration in a capacity-
constrained Self-Managed deployment, make sure your node pools have enough
spare capacity for the burst replicas you expect to run; see [Resize node
pools](/self-managed-deployments/deployment-guidelines/resize-node-pools/).
## Limitations
- Autoscaling for hydration only speeds up the initial hydration of indexes,
materialized views, and Kafka upsert sources. It does not help with ongoing
freshness or staleness, and it has no effect on
[single-replica sources](/fundamentals/concepts/hydration/#objects-and-hydration)
(PostgreSQL, MySQL, and SQL Server sources), which stay pinned to one replica
regardless of the strategy.
- `AUTO SCALING STRATEGY` cannot be combined with a `SCHEDULE` other than the
default `MANUAL`, and is only available on managed clusters.
- Autoscaling for hydration does not apply to the new generation during a
Materialize Self-Managed version upgrade. Until it's promoted, the new
generation runs read-only and can't provision a burst replica, so it
hydrates only at its configured steady `SIZE`. See [Rollout
strategies](/self-managed-deployments/upgrading/#rollout-strategies).
## Related pages
- [Hydration](/fundamentals/concepts/hydration/)
- [Optimize hydration requirements](/clusters/optimize-hydration-requirements/)
- [`CREATE CLUSTER`](/sql/create-cluster/#autoscaling)
- [`ALTER CLUSTER`](/sql/alter-cluster/#speed-up-hydration-by-autoscaling-to-a-larger-size)
- [`mz_internal.mz_cluster_auto_scaling_strategies`](/sql/system-catalog/mz_internal/#mz_cluster_auto_scaling_strategies)
- [Blue/green deployments](/developer-tools/dbt/blue-green-deployments/)
---
## M.1 to cc size mapping
The following table provides a general mapping between cc and M.1 cluster sizes:
**cc to M.1:**
| cc Size | M.1 Size |
| --- | --- |
| 25cc | M.1-nano |
| 50cc | M.1-nano |
| 100cc | M.1-micro |
| 200cc | M.1-xsmall |
| 300cc | M.1-small |
| 400cc | M.1-small |
| 600cc | M.1-medium |
| 800cc | M.1-large or M.1-medium |
| 1200cc | M.1-1.5xlarge |
| 1600cc | M.1-2xlarge or M.1-1.5xlarge |
| 3200cc | M.1-8xlarge or M.1-4xlarge or M.1-3xlarge |
| 6400cc | M.1-16xlarge |
| 128C | M.1-32xlarge |
| 256C | M.1-64xlarge |
| 512C | M.1-128xlarge |
**M.1 to cc:**
| M.1 Size | cc Size |
| --- | --- |
| M.1-nano | 25cc |
| M.1-nano | 50cc |
| M.1-micro | 100cc |
| M.1-xsmall | 200cc |
| M.1-small | 300cc or 400cc |
| M.1-medium | 600cc or 800cc |
| M.1-large | 800cc |
| M.1-1.5xlarge | 1200cc or 1600cc |
| M.1-2xlarge | 1600cc |
| M.1-3xlarge | 3200cc |
| M.1-4xlarge | 3200cc |
| M.1-8xlarge | 3200cc |
| M.1-16xlarge | 6400cc |
| M.1-32xlarge | 128C |
| M.1-64xlarge | 256C |
| M.1-128xlarge | 512C |
Some sizes have multiple mappings. When converting between cc and M.1 sizing, we
recommend choosing the larger mapping size first.
---
## Operational guidelines
The following provides some general guidelines for production.
## Clusters
### Production clusters for production workloads only
Use production cluster(s) for production workloads only. That is, avoid using
production cluster(s) to run development workloads or non-production tasks.
### Three-tier architecture
In production, use a three-tier architecture, if feasible.
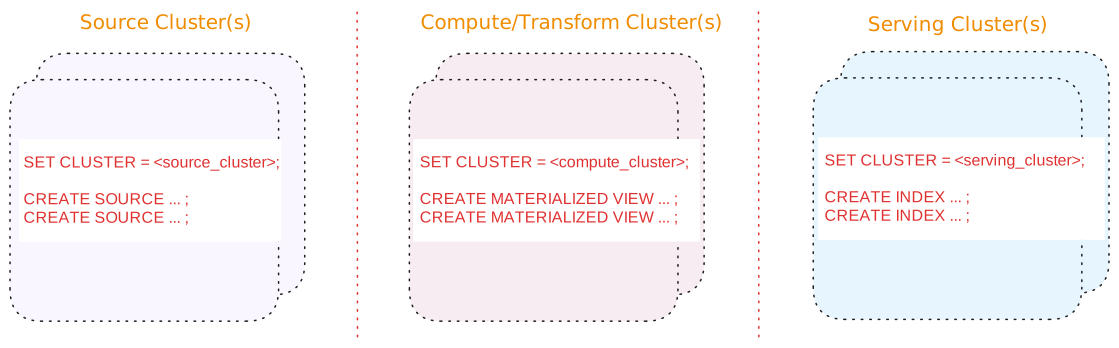
A three-tier architecture consists of:
| Tier | Description |
| --- | --- |
| Source cluster(s) | A dedicated cluster(s) for sources.
In addition, for upsert sources:
-
Consider separating upsert sources from your other sources. Upsert sources have higher resource requirements (since, for upsert sources, Materialize maintains each key and associated last value for the key as well as to perform deduplication). As such, if possible, use a separate source cluster for upsert sources.
-
Consider using a larger cluster size during snapshotting for upsert sources. Once the snapshotting operation is complete, you can downsize the cluster to align with the steady-state ingestion.
|
| Compute/Transform cluster(s) | A dedicated cluster(s) for compute/transformation:
-
Materialized views to persist, in durable storage, the results that will be served. Results of materialized views are available across all clusters.
> **Tip:** If you are using stacked views (i.e., views whose definition depends > on other views) to reduce SQL complexity, generally, only the topmost > view (i.e., the view whose results will be served) should be a > materialized view. The underlying views that do not serve results do not > need to be materialized. -
Indexes, only as needed, to make transformation fast (such as possibly indexes on join keys).
> **Tip:** From the compute/transformation clusters, do not create indexes on the > materialized views for the purposes of serving the view results. > Instead, use the [serving cluster(s)](#tier-serving-clusters) when > creating indexes to serve the results.
|
| Serving cluster(s) | A dedicated cluster(s) for serving queries, including indexes on the materialized views. Indexes are local to the cluster in which they are created. |
Benefits of a three-tier architecture include:
#### Alternatives
If a three-tier architecture is infeasible or unnecessary due to low volume or a
non-production setup, a two cluster or a single cluster architecture may
suffice.
See [Appendix: Alternative cluster
architectures](/clusters/operational-guidelines/appendix-alternative-cluster-architectures/) for details.
## Sources
### Scheduling
If possible, schedule creating new sources during off-peak hours to mitigate
the impact of snapshotting on both the upstream system and the Materialize
cluster.
### Separate cluster(s) for sources
In production, if possible, use a dedicated cluster for
[sources](/fundamentals/concepts/sources/); i.e., avoid putting sources on the same cluster
that hosts compute objects, sinks, and/or serves queries.
In addition, for upsert sources:
- Consider separating upsert sources from your other sources. Upsert sources
have higher resource requirements (since, for upsert sources, Materialize
maintains each key and associated last value for the key as well as to perform
deduplication). As such, if possible, use a separate source cluster for upsert
sources.
- Consider using a larger cluster size during snapshotting for upsert sources.
Once the snapshotting operation is complete, you can downsize the cluster to
align with the steady-state ingestion.
See also [Production cluster architecture](#three-tier-architecture).
## Sinks
### Separate sinks from sources
To allow for [blue/green deployment](/developer-tools/dbt/blue-green-deployments/), avoid
putting sinks on the same cluster that hosts sources .
See also [Cluster architecture](#three-tier-architecture).
## Snapshotting considerations
For upsert sources, snapshotting is a resource-intensive operation that can require a significant amount of CPU and memory.
## Hydration considerations
When sizing a cluster, budget for hydration memory on top of the steady-state
cost. Rather than estimating that budget, start at a size that hydrates
comfortably and size down once you have measured what hydration needed: see
[Optimize cluster size](/clusters/sizing/). For strategies to reduce hydration
memory, see [Optimize hydration
requirements](/clusters/optimize-hydration-requirements/).
The table below summarizes, per object type, when each object hydrates and
the memory it uses. For more on hydration, see
[Hydration](/fundamentals/concepts/hydration/).
| Object | Hydration behavior |
| --- | --- |
| Materialized views | - **When**: Hydrates on creation and on every replica (re)start or cluster resize. - **What**: Rebuilds the dataflow's operator state: the arrangements that joins, aggregations, and similar operators keep to update results incrementally. Note: A materialized view's result lives in durable storage, so it rebuilds only this maintenance state, not the result. - **Memory Use**: Scales with the view's definition, which it holds at steady state, plus a transient output buffer up to twice the output size: the current output plus a read-back of the previously persisted output. On first creation, since there is no previous output, the buffer is a single output size. |
| Indexes | - **When**: Hydrates on creation and on every replica (re)start or cluster resize. - **What**: Rebuilds the arranged (indexed) data it keeps in memory to serve reads, plus any operator arrangements its dataflow maintains (for joins, aggregations, and similar). - **Memory Use**: Its memory is proportional to the indexed data plus those arrangements, and is held for as long as the index exists. |
| Kafka upsert sources and associated read-only tables/subsources | - **When**: On replica (re)start or cluster resize. These sources do not hydrate on creation; instead, on creation, their indexes are built as part of [snapshotting](/fundamentals/concepts/snapshotting/). - **What**: Rebuilds the table's or subsource's internal upsert index from storage. - **Memory Use**: The index holds the latest value per key, so its memory scales with the source's key space. On standard cluster sizes it can spill to disk when the key space exceeds memory. |
| Append-only Kafka sources and CDC database sources (PostgreSQL, MySQL, SQL Server), and their read-only tables/subsources | - **When**: On replica (re)start or cluster resize, marked hydrated as soon as the dataflow starts. - **What**: Effectively nothing. These sources keep no internal index to rebuild and resume from their persisted position, so hydration is a no-op. - **Memory Use**: Negligible, since there is no index to hold. |
| Webhook sources | Not applicable. A webhook source is not maintained by a dataflow. It receives data pushed over HTTP and writes the data directly to storage, so it does not hydrate. |
| Sinks | - **When**: If created `WITH (SNAPSHOT = true)` (the default), hydrates: - On creation, when the sink first emits its input snapshot. - On a replica (re)start, but only if the sink restarted before recording any progress: it then re-reads the whole input snapshot, and any data already written to the external system is discarded, but the memory cost still occurs. An established sink resumes from its recorded progress without re-reading the snapshot. - **What**: Loads a full copy of its input snapshot into the arrangement that feeds the sink before it can emit. - **Memory Use**: Peaks at roughly a full copy of the input snapshot, then decreases as the snapshot is written out. Negligible on a restart of an established sink. At steady state, a sink retains little in memory. |
| Subscriptions | - **When**: On creation and, while it remains active, on every replica (re)start: the dataflow is re-installed on the (re)started replica and the subscription resumes. A subscription that targets a specific replica instead ends with an error when that replica restarts. A subscription ends with its session and is not reported in `mz_hydration_statuses`. - **What**: Rebuilds the dataflow when it starts. - **Memory Use**: Scales with the dataflow, held while the subscription runs. |
## Role-based access control (RBAC)
**Cloud:**
### Cloud
##### Follow the principle of least privilege
Role-based access control in Materialize should follow the principle of
least privilege. Grant only the minimum access necessary for users and
service accounts to perform their duties.
##### Restrict the assignment of **Organization Admin** role
{{% include-headless "/headless/rbac-cloud/org-admin-recommendation" %}}
##### Restrict the granting of `CREATEROLE` privilege
{{% include-headless "/headless/rbac-cloud/createrole-consideration" %}}
##### Use Reusable Roles for Privilege Assignment
{{% include-headless "/headless/rbac-cloud/use-resusable-roles" %}}
See also [Manage database roles](/security/access-control/manage-roles/).
##### Audit for unused roles and privileges.
{{% include-headless "/headless/rbac-cloud/audit-remove-roles" %}}
See also [Show roles in
system](/security/cloud/access-control/manage-roles/#show-roles-in-system) and [Drop
a role](/security/cloud/access-control/manage-roles/#drop-a-role) for more
information.
**Self-Managed:**
### Self-Managed
##### Follow the principle of least privilege
Role-based access control in Materialize should follow the principle of
least privilege. Grant only the minimum access necessary for users and
service accounts to perform their duties.
##### Restrict the granting of `CREATEROLE` privilege
{{% include-headless "/headless/rbac-sm/createrole-consideration" %}}
##### Use Reusable Roles for Privilege Assignment
{{% include-headless "/headless/rbac-sm/use-resusable-roles" %}}
See also [Manage database roles](/security/self-managed/access-control/manage-roles/).
##### Audit for unused roles and privileges.
{{% include-headless "/headless/rbac-sm/audit-remove-roles" %}}
See also [Show roles in
system](/security/self-managed/access-control/manage-roles/#show-roles-in-system)
and [Drop a
role](/security/self-managed/access-control/manage-roles/#drop-a-role) for
more information.
---
## Optimize hydration requirements
[Hydration](/fundamentals/concepts/hydration/) primarily impacts memory usage,
and its speed scales with cluster size. This guide covers strategies to reduce
the memory a cluster needs during hydration, speed hydration up, or avoid
triggering it in the first place.
## Isolate hydration-heavy objects
- Use a dedicated cluster for [sources](/fundamentals/concepts/sources/).
- In addition, use a dedicated cluster for upsert sources; i.e., do not
co-locate with append-only Kafka sources or CDC database sources.
- Keeping append-only Kafka sources and CDC database sources (PostgreSQL,
MySQL, and SQL Server sources) on a separate cluster isolates ingestion
from possible OOM loops caused by memory-heavy objects such as Kafka
upsert sources.
- Note: PostgreSQL, MySQL, and SQL Server sources run on a single replica,
the oldest, and remain there until that replica is removed. As such,
[autoscaling for hydration](/clusters/autoscaling/) has no impact on
these single-replica sources.
- Distribute materialized views and indexes across multiple clusters. Each
cluster's replicas hydrate their objects independently, which distributes
the memory required for hydration, lets objects on different clusters
hydrate in parallel, and limits how much must re-hydrate when any one
replica restarts.
## Limit concurrent hydration
By default, a replica hydrates up to 4 dataflows at a time. Lowering this
limit spreads out the memory spikes from hydrating many objects at once, at
the cost of a longer total hydration time; raising it can shorten total
hydration time at the cost of a higher peak.
- On self-managed deployments, set the `compute_hydration_concurrency` system
parameter yourself:
```mzsql
ALTER SYSTEM SET compute_hydration_concurrency = 2;
```
See [Configuring system
parameters](/self-managed-deployments/configuration-system-parameters/) for
other ways to set it.
- On Materialize Cloud, [contact our team](/support/) to have it configured
for your cluster.
## Reuse arrangements across consumers
If multiple objects in the **same** cluster consume the same view, add an
[index](/fundamentals/concepts/indexes/) to that view **before** creating the
consumers. Consumers in that cluster can reuse the indexed arrangement instead
of each building equivalent in-memory state, which can reduce both memory
usage during hydration and steady-state memory.
- Index reuse is limited to the cluster the index is on, and the index must
exist **before** its consumers are created for the optimizer to reuse it.
- For a view with only one consumer, an index generally adds memory instead of
saving it.
## Split large materialized views
For a very large materialized view, consider splitting it into several
smaller materialized views, for example by a partition key such as customer,
region, or date range. Smaller materialized views can hydrate as separate
dataflows, which can bound peak memory compared with hydrating one very large
materialized view.
- This helps most when a cluster runs only a few large materialized views,
where a single view's hydration spike can dictate the cluster size. A
cluster with many materialized views already hydrates them as separate
dataflows and gets this benefit naturally.
- A re-plan or replacement of one split view affects only that portion of the
data. A replica restart still re-hydrates all views on the replica, though
in smaller units.
- If the split views share expensive computation, put that computation in a
[common indexed view first](#reuse-arrangements-across-consumers), creating
the index **before** creating the split views. Otherwise, each split view
may rebuild its own copy of the shared work, increasing total memory.
- Queries must target or combine the split views.
## Reduce arrangement memory
- For multi-way joins (more than two inputs), a [delta
join](/transform-data/optimization/#optimize-multi-way-joins-with-delta-joins)
keeps no intermediate results in memory, unlike a differential join. Index
all the join keys so the optimizer can choose a delta join.
- If your workload has columns with a small set of often-repeated values (for
example, status strings or enum-like labels), [dictionary
compression](/transform-data/dictionary-compression/) can reduce the memory
those arrangements use, at the cost of CPU and slower hydration.
- Avoid setting [`RETAIN HISTORY`](/serve-results/durable-subscriptions/) on
indexes: an index's arrangement holds its full retained history in memory,
not just the storage layer. Configure history retention on a materialized
view instead.
## Provision extra capacity while hydrating
For a cluster with memory-heavy objects, add an `AUTO SCALING STRATEGY (ON
HYDRATION)` to provision a temporary, larger burst replica while the cluster
has unhydrated objects; you pay for it only while it's provisioned. See
[Autoscaling for hydration](/clusters/autoscaling/) for how to configure,
monitor, and troubleshoot it, including what to do if a steady-size replica
never catches up.
## Avoid unnecessary full-cluster hydration
When changing a materialized view or index, or forcing dependents to re-plan
(for example, after dropping an index and recreating the dependents), build
the new version to the side to avoid downtime:
- A [blue/green deployment](/developer-tools/dbt/blue-green-deployments/)
hydrates the new version alongside the old and cuts over when hydrated, with
no serving gap. Note that blue/green requires sources and sinks to live on
dedicated clusters that are excluded from the swap. For more information,
see [blue/green deployment](/developer-tools/dbt/blue-green-deployments/).
- For a single materialized view, creating and hydrating a [replacement
materialized view (public preview) and replacing the existing view in
place](/transform-data/updating-materialized-views/replace-materialized-view/)
may be simpler, but briefly reduces freshness. The replacement materialized
view can be either on the same or different cluster.
> **Note:** A [slim deployment](/developer-tools/dbt/slim-deployments/) that redeploys
> only changed objects onto a copy of a cluster only exercises those objects'
> hydration spike, not the full cluster's combined spike. A cluster that
> passes a slim deployment can still fail to hydrate on the next full restart
> or upgrade. Use a [blue/green
> deployment](/developer-tools/dbt/blue-green-deployments/) in production to
> validate hydration for the whole cluster.
> **Note:** The burst-replica and blue/green strategies run extra replicas alongside the
> existing ones, as do a resize or a zero-downtime upgrade. During the overlap,
> the cluster temporarily uses additional resources. Account for the additional
> cost and, on self-managed deployments, the additional capacity required.
## Related pages
- [Hydration](/fundamentals/concepts/hydration/)
- [Optimize cluster size](/clusters/sizing/)
- [Operational guidelines](/clusters/operational-guidelines/)
- [Autoscaling for hydration](/clusters/autoscaling/)
- [Configuring system parameters](/self-managed-deployments/configuration-system-parameters/)
- [Query optimization](/transform-data/optimization/)
- [Dictionary compression](/transform-data/dictionary-compression/)
- [Durable subscriptions](/serve-results/durable-subscriptions/)
- [Snapshotting](/fundamentals/concepts/snapshotting/)
- [Clusters](/fundamentals/concepts/clusters/)
- [Troubleshooting](/serve-results/troubleshooting/#hydrating-objects)
---
## Size clusters for hydration
A cluster's [size](/sql/create-cluster/#available-sizes) defines the CPU,
memory, and scratch disk available to every replica. On Materialize Cloud, this
determines the [cost](/materialize-cloud/billing/#compute) of the cluster.
Clusters should be provisioned for peak resource usage, to ensure that they can
handle the load placed on them. For most clusters, peak resource usage happens
during [hydration](/fundamentals/concepts/hydration/).
This guide will walk you through how to estimate resources required for
hydration. Before reading this guide, make sure you understand the [lifecycle of
a cluster](/fundamentals/concepts/clusters/#lifecycle-of-a-cluster).
> **Note:** Hydration rebuilds a dataflow's in-memory state from the storage layer, which
> can take more memory than maintaining that state afterwards. The size that holds a
> hydrated cluster is therefore not always the size that can rebuild it, and a
> replica that runs out of memory while hydrating restarts and tries again rather
> than running slower.
## Determine the right size by starting large, and then size down
This guide assumes you are running Materialize v26.42 or later. v26.42 added
improvements to allow you to track peak resource usage during hydration.
> **Note:** **Multi-process replicas.** `peak_memory_bytes` is a single process's
> high-water mark, not the replica's. On a multi-process size it does not capture
> the replica's true peak, and no way to combine the per-process marks into one is
> established. This guide assumes a single-process size.
### 1. Create the cluster at a generous size
Pick a size you are confident can hydrate the workload, even if it is clearly
more than steady state needs.
```mzsql
CREATE CLUSTER analytics (SIZE = '400cc');
```
Then create the cluster's indexes and materialized views as usual.
### 2. Wait for the cluster to hydrate
Every object has to finish hydrating before the numbers describe the whole
workload. Check that nothing is still hydrating:
```mzsql
SELECT o.name AS object, h.replica_id, h.hydrated
FROM mz_internal.mz_hydration_statuses AS h
JOIN mz_catalog.mz_objects AS o ON o.id = h.object_id
JOIN mz_catalog.mz_clusters AS c ON c.id = o.cluster_id
WHERE c.name = 'analytics' AND h.hydrated IS NOT TRUE;
```
An empty result means every object on the cluster is hydrated. A row with a
`NULL` `replica_id` is an object that has not attached to a replica yet, which
`IS NOT TRUE` catches along with `hydrated = false`.
### 3. Read what the last hydration required
Materialize records completed hydration episodes. [`mz_internal.mz_replica_hydration_history`](/sql/system-catalog/mz_internal/#mz_replica_hydration_history)
holds one row per replica-wide hydration episode:
```mzsql
SELECT
rh.replica_name AS replica,
rh.size,
h.started_at,
h.finished_at - h.started_at AS hydration_time,
h.object_count,
pg_size_pretty(h.peak_memory_bytes) AS peak_memory,
pg_size_pretty(h.peak_disk_bytes) AS peak_disk
FROM mz_internal.mz_replica_hydration_history AS h
JOIN mz_internal.mz_cluster_replica_history AS rh ON rh.replica_id = h.replica_id
WHERE rh.cluster_name = 'analytics'
ORDER BY h.started_at DESC;
```
```none
replica | size | started_at | hydration_time | object_count | peak_memory | peak_disk
---------+-------+-------------------------------+----------------+--------------+-------------+-----------
r1 | 400cc | 2026-09-08 09:12:04.117841+00 | 00:04:11.83 | 41 | 11 GB | 2438 MB
(1 row)
```
`peak_memory` is the highest memory any process on the replica reached, from
process start through the moment the episode was recorded. For sizing that is
the useful direction: it bounds the hydration peak rather than under-reporting
it.
Compare `peak_memory` against the replica sizes in
[`mz_catalog.mz_cluster_replica_sizes`](/sql/system-catalog/mz_catalog/#mz_cluster_replica_sizes), and use this to
determine the ideal cluster size. Both figures are per process.
To find which object dominated the episode, read the per-object table,
[`mz_internal.mz_object_hydration_history`](/sql/system-catalog/mz_internal/#mz_object_hydration_history).
Its `object_id` is the ID of the object's dataflow, so reach the catalog item
through
[`mz_internal.mz_object_global_ids`](/sql/system-catalog/mz_internal/#mz_object_global_ids):
```mzsql
SELECT
rh.replica_name AS replica,
o.name AS object,
o.type,
h.hydrated_at - h.installed_at AS hydration_time
FROM mz_internal.mz_object_hydration_history AS h
JOIN mz_internal.mz_object_global_ids AS g ON g.global_id = h.object_id
JOIN mz_catalog.mz_objects AS o ON o.id = g.id
JOIN mz_internal.mz_cluster_replica_history AS rh ON rh.replica_id = h.replica_id
WHERE rh.cluster_name = 'analytics'
ORDER BY hydration_time DESC
LIMIT 5;
```
```none
replica | object | type | hydration_time
---------+---------------------+-------------------+-----------------
r1 | auction_summary | materialized-view | 00:04:11.83
r1 | bids_by_auction | materialized-view | 00:01:47.21
r1 | bids_by_auction_idx | index | 00:00:22.04
r1 | auction_summary_idx | index | 00:00:19.88
(4 rows)
```
Every replica records its own rows, so a cluster with a replication factor
above one, or one that has been resized, returns a row per object per replica.
If one object accounts for most of the episode, [move it to its own
cluster](/clusters/optimize-hydration-requirements/) so its
hydration peak stops dictating the size of everything else.
### 4. Size down
Once you have identified the appropriate size, you can downsize by altering the
cluster:
```mzsql
ALTER CLUSTER analytics SET (SIZE = '100cc');
```
`ALTER CLUSTER` operations are graceful. This means the smaller cluster will
hydrate in parallel, and Materialize will cut over to the smaller cluster when
it is ready.
The resize also hydrates the whole workload again, which produces exactly the
measurement you need to confirm the new size. Re-run the query from [step
3](#read-what-the-last-hydration-needed) once the new replica is hydrated:
```none
replica | size | started_at | hydration_time | object_count | peak_memory | peak_disk
---------+-------+-------------------------------+----------------+--------------+-------------+-----------
r2 | 100cc | 2026-09-08 10:41:22.913044+00 | 00:12:37.42 | 41 | 12 GB | 4310 MB
r1 | 400cc | 2026-09-08 09:12:04.117841+00 | 00:04:11.83 | 41 | 11 GB | 2438 MB
(2 rows)
```
If the new size is too small, no completed episode is recorded for the new
replica at all. Only successful hydration is recorded, so an out-of-memory
restart loop shows up as a missing row plus repeated restarts in
[`mz_internal.mz_cluster_replica_status_history`](/sql/system-catalog/mz_internal/#mz_cluster_replica_status_history):
```mzsql
SELECT sh.occurred_at, sh.process_id, sh.status, sh.reason
FROM mz_internal.mz_cluster_replica_status_history AS sh
JOIN mz_internal.mz_cluster_replica_history AS rh ON rh.replica_id = sh.replica_id
WHERE rh.cluster_name = 'analytics'
ORDER BY sh.occurred_at DESC
LIMIT 10;
```
If you see repeated `offline` rows with an out-of-memory `reason`, that means
the new size is too small. Size up, or consider [optimizing hydration
requirements](/clusters/optimize-hydration-requirements/) to reduce the memory
required for hydration.
## How should I interpret the hydration metrics?
Hydration history is a best-effort record, not an audit log. Where it is
approximate, it is approximate in ways that matter for sizing:
- **Only successful episodes are recorded.** There is no row for a hydration
that was killed, canceled, or is still running, and `status` is currently
always `hydrated`. A missing row is a signal in its own right, as in step 4,
but it is never a measurement of a failure.
- **Only indexes and materialized views are tracked per object.** Sources,
including upsert sources, contribute no rows to object history and do not hold
a replica episode open. The replica peaks measure whole processes, so they
include a source's memory and disk only for the work it had finished by the
moment the episode was recorded. An episode closes on the compute dataflows,
and [snapshotting](/fundamentals/concepts/snapshotting/) an upsert source
often runs well past that, so a cluster whose peak is driven by snapshotting
is not sized by these numbers. Read
[`mz_internal.mz_cluster_replica_metrics_history`](/sql/system-catalog/mz_internal/#mz_cluster_replica_metrics_history)
for that instead.
- **Short-lived objects can be missed entirely.** Recording works by sampling
each replica in a rotation, so an object that is dropped before its replica's
turn leaves no trace. Nothing incorrect is recorded, the episode is simply
absent.
- **`peak_memory_bytes` is an upper bound on the episode.** It comes from the
kernel's own high-water mark, covering each process's whole lifetime up to the
moment the episode is recorded, so post-hydration work can raise it and a
later episode can inherit an earlier episode's mark. For sizing memory this
errs the safe way: the recorded value is never below the true hydration peak.
- **`peak_disk_bytes` is a lower bound.** Materialize periodically samples this metric and can miss spikes. Leave more headroom on disk
than the number by itself implies.
- **Timestamps can carry clock skew.** On a multi-process replica the endpoints
of an interval come from different process clocks, so a recorded duration
includes their skew. This is not usually visible at the minute scale that
matters for sizing.
- **Rows outlive what they name.** `replica_id`, `cluster_id`, and `object_id`
may all name objects that no longer exist, which is what makes the history
useful across a resize. Join `mz_cluster_replica_history` for replica and
cluster names, and expect the join through `mz_object_global_ids` to drop
objects that have since been dropped.
- **Rows are retained for 30 days by default.** Sizing decisions should come
from the recent history rather than the earliest episode still stored.
## What should I do if hydration history is empty?
Recording is controlled by the `hydration_history_collection_interval` system
parameter, which sets how often Materialize samples replicas for completed
episodes. A value of zero disables recording, and the tables then stay as they
are: rows already collected remain, and no new ones are added.
`hydration_history_retention_period` bounds how long rows live, and defaults to
30 days.
On Materialize Cloud, these parameters are managed for you. If both tables are
empty for a cluster that has certainly hydrated, contact
[support](/support/).
On Materialize Self-Managed, set them as the `mz_system` user, or through the
[system parameters
ConfigMap](/self-managed-deployments/configuration-system-parameters/):
```mzsql
ALTER SYSTEM SET hydration_history_collection_interval = '60s';
```
A shorter interval records episodes sooner, at the cost of installing a dataflow
on a replica more often. Recording visits one replica per interval, so an
environment with many replicas revisits each one proportionally less often.
Until history is available, the current-state relations still answer the
narrower question of what is happening now:
| Relation | What it gives you |
|----------|-------------------|
| [`mz_internal.mz_hydration_statuses`](/sql/system-catalog/mz_internal/#mz_hydration_statuses) | Per-object, per-replica hydration flag, for every object type. |
| [`mz_internal.mz_compute_hydration_statuses`](/sql/system-catalog/mz_internal/#mz_compute_hydration_statuses) | The same flag plus how long hydration took, for indexes and materialized views. |
| [`mz_internal.mz_cluster_replica_metrics_history`](/sql/system-catalog/mz_internal/#mz_cluster_replica_metrics_history) | CPU, memory, and disk sampled about once a minute, retained for 30 days. |
The two hydration relations report only the current state and are reset by a
replica or Materialize restart. The metrics history survives restarts, but at
roughly one sample a minute it can miss a hydration spike entirely, and it does
not tell you which episode a sample belonged to. That is why these are a
fallback rather than the basis for a sizing decision.
## How do I speed up hydration?
Hydration speed scales with cluster size, so a cluster can borrow capacity for
hydration alone rather than running at the larger size permanently. See
[autoscaling for hydration](/clusters/autoscaling/), which provisions an extra
burst replica at a larger size whenever the cluster has un-hydrated objects and
removes it once a steady-size replica catches up.
To reduce the work hydration has to do in the first place, see [Optimize
hydration requirements](/clusters/optimize-hydration-requirements/).
## Related pages
- [Hydration](/fundamentals/concepts/hydration/)
- [Optimize hydration requirements](/clusters/optimize-hydration-requirements/)
- [Clusters](/fundamentals/concepts/clusters/)
- [Operational guidelines](/clusters/operational-guidelines/)
- [Autoscaling for hydration](/clusters/autoscaling/)
- [`CREATE CLUSTER`](/sql/create-cluster/)
- [`ALTER CLUSTER`](/sql/alter-cluster/)
- [Usage & billing](/materialize-cloud/billing/)
---
## System clusters
## Overview
When you enable a Materialize region, various [system
clusters](/sql/system-clusters/) are pre-installed to improve the user
experience as well as support system administration tasks.
### `quickstart` cluster
A cluster named `quickstart` with a size of `25cc` and a replication factor of
`1` will be pre-installed in every environment. You can modify or drop this
cluster at any time.
> **Note:** The default value for the `cluster` session parameter is `quickstart`.
> This cluster functions as a default option, pre-created for your convenience.
> It allows you to quickly start running queries without needing to configure a cluster first.
> If the `quickstart` cluster is dropped, you must run [`SET cluster`](/sql/select/#ad-hoc-queries)
> to choose a valid cluster in order to run `SELECT` queries. A _superuser_ (i.e. `Organization Admin`)
> can also run [`ALTER SYSTEM SET cluster`](/sql/alter-system-set) to change the
> default value.
### `mz_catalog_server` system cluster
A system cluster named `mz_catalog_server` will be pre-installed in every
environment. This cluster has several indexes installed to speed up `SHOW`
commands and queries using the system catalog.
To take advantage of these indexes, Materialize will automatically re-route
`SHOW` commands and queries using system catalog objects to the
`mz_catalog_server` system cluster. You can disable this behavior in
your session via the `auto_route_catalog_queries`
[configuration parameter](/sql/show/#other-configuration-parameters).
The following characteristics apply to the `mz_catalog_server` cluster:
* You are **not billed** for this cluster.
* You cannot create objects in this cluster.
* You cannot drop this cluster.
* You can run `SELECT` or `SUBSCRIBE` queries in this cluster as long
as you only reference objects in the [system catalog](/sql/system-catalog/).
### `mz_probe` system cluster
A system cluster named `mz_probe` will be pre-installed in every environment.
This cluster is used for internal uptime monitoring.
The following characteristics apply to the `mz_probe` cluster:
* You are **not billed** for this cluster.
* You cannot create objects in this cluster.
* You cannot drop this cluster.
* You cannot run `SELECT` or `SUBSCRIBE` queries in this cluster.
### `mz_support` system cluster
A system cluster named `mz_support` will be pre-installed in every environment.
This cluster is used for internal support tasks.
The following characteristics apply to the `mz_support` cluster:
* You are **not billed** for this cluster.
* You cannot create objects in this cluster.
* You cannot drop this cluster.
* You cannot run `SELECT` or `SUBSCRIBE` queries in this cluster.
### `mz_system` system cluster
A system cluster named `mz_system` will be pre-installed in every environment.
This cluster is used for internal system jobs.
The following characteristics apply to the `mz_system` cluster:
* You are **not billed** for this cluster.
* You cannot create objects in this cluster.
* You cannot drop this cluster.
* You cannot run `SELECT` or `SUBSCRIBE` queries in this cluster.
## Related pages
- [`CREATE CLUSTER`](/sql/create-cluster)
- [`SHOW CLUSTER`](/sql/show-clusters)
- [`DROP CLUSTER`](/sql/drop-cluster)
---
## Troubleshoot anomalies in CPU usage
A cluster replica's CPU goes to the dataflows that maintain the cluster's
indexes, materialized views, and sinks, and to the ad-hoc queries served from
it. An anomaly in CPU usage means one of those started doing more work, or that
the same work stopped being spread evenly across the replica's workers.
Each section below covers one cause, with the queries that diagnose it, how to
resolve it, and how to prevent it from recurring.
> **Important:** The introspection relations and `EXPLAIN ANALYZE` statements in this guide
> report on **the cluster and replica your session is connected to**. Run
> `SET CLUSTER TO ` first, and re-run per replica on a cluster with
> a replication factor above 1.
## Common causes
| Cause | Description |
| ----- | ----------- |
| [Worker skew](#worker-skew) | One worker does far more work than its peers, so the replica saturates a core while the rest idle. |
| [An expensive object](#an-expensive-object) | A single dataflow dominates the cluster's CPU. |
| [Hydration](#hydration) | A replica restart, cluster resize, or DDL forced objects to rebuild from their inputs. |
| [Ad-hoc query load](#ad-hoc-query-load) | `SELECT`s served by the cluster compete with its maintenance work. |
| [Upstream data volume](#upstream-data-volume) | More data is arriving from sources, so there is more incremental work to do. |
| [Memory pressure causing increased spill to disk](#memory-pressure-causing-increased-spill-to-disk) | A replica near its memory limit burns CPU on I/O rather than on your dataflows. |
| [An undersized cluster](#an-undersized-cluster) | The cluster has no headroom left for the workload it carries. |
## First, confirm the spike window and scope
Establish when the anomaly started and which replicas it affected, replacing
`` with the name of your cluster:
```mzsql
SELECT
u.occurred_at,
r.name AS replica_name,
u.cpu_percent
FROM mz_internal.mz_cluster_replica_utilization_history u
JOIN mz_catalog.mz_cluster_replicas r ON u.replica_id = r.id
JOIN mz_catalog.mz_clusters c ON r.cluster_id = c.id
WHERE c.name = ''
AND u.occurred_at > now() - INTERVAL '6 hours'
ORDER BY u.occurred_at DESC;
```
```nofmt
occurred_at | replica_name | cpu_percent
----------------------------+--------------+--------------
2026-09-15 16:26:44.899+00 | r1 | 39.634147625
2026-09-15 16:25:44.9+00 | r1 | 34.412956225
2026-09-15 16:24:44.899+00 | r1 | 34.81781385
2026-09-15 16:23:44.904+00 | r1 | 0
2026-09-15 16:22:46.4+00 | r1 |
(5 rows)
```
Samples land about once a minute, and each one is a difference against the
previous sample, so the oldest row of a replica's history has a `NULL`
`cpu_percent`.
Every replica of a cluster maintains the same objects, so:
- If **all replicas** spike together, the workload itself changed. Continue with
the checks below.
- If **one replica** spikes, that replica is doing something its peers are not,
most often rehydrating after a restart. See [Hydration](#hydration).
- If the anomaly **repeats on a fixed cadence**, or CPU stays high while the
cluster's inputs are idle, suspect a [temporal
filter](/transform-data/optimization/#improve-performance-when-using-temporal-filters).
A window whose boundary moves with `mz_now()` retracts rows as they age out,
so it generates work with no upstream input at all.
> **Important:** `cpu_percent` is a percentage of the replica's *total* allocation across all of
> its cores, so it averages over workers. A replica whose work is concentrated on
> one worker can peg a core while reporting a modest `cpu_percent`.
> **Low CPU is therefore not a clean bill of health.** Degraded freshness with
> unremarkable CPU is the signature of [worker skew](#worker-skew): the busy
> worker is saturated, and averaging it against idle peers hides that.
Which way the number points tells you which check to run first:
- **CPU is high**: the cluster is doing more work than it can absorb. Start
with [an expensive object](#an-expensive-object).
- **CPU is low but freshness is degraded**: the work is not being spread across
workers. Start with [worker skew](#worker-skew).
## Worker skew
Materialize distributes work across a replica's workers by hashing keys, such
as join keys and `GROUP BY` keys. If one key value accounts for a
disproportionate share of rows, the worker responsible for that value does
disproportionate work while its peers idle.
A cross join is the extreme case. It has no join key to hash on, so every cross
join running on a replica moves all of its data to a single worker, no matter
how the input values are distributed.
### Diagnosing the issue
**Step 1. Find the skewed object.** Connect to the cluster and run
[`EXPLAIN ANALYZE CLUSTER CPU WITH
SKEW`](/sql/explain-analyze/#explain-analyze--with-skew):
```mzsql
SET CLUSTER TO ;
EXPLAIN ANALYZE CLUSTER CPU WITH SKEW;
```
```nofmt
object | global_id | worker_id | max_operator_cpu_ratio | worker_elapsed | avg_elapsed | total_elapsed
------------------------------------------+-----------+-----------+------------------------+-----------------+-----------------+-----------------
materialize.public.orders_enriched | t356 | 2 | 3.74 | 00:00:00.675664 | 00:00:00.207876 | 00:00:00.831505
materialize.public.orders_enriched | t356 | 1 | 1.85 | 00:00:00.033013 | 00:00:00.207876 | 00:00:00.831505
materialize.public.orders_by_customer | t365 | 1 | 1.57 | 00:00:00.188396 | 00:00:00.120242 | 00:00:00.48097
materialize.public.orders_by_customer | t365 | 2 | 1.17 | 00:00:00.140562 | 00:00:00.120242 | 00:00:00.48097
materialize.public.orders_by_customer | t365 | 3 | 0.81 | 00:00:00.097985 | 00:00:00.120242 | 00:00:00.48097
materialize.public.orders_enriched | t356 | 0 | 0.77 | 00:00:00.079949 | 00:00:00.207876 | 00:00:00.831505
materialize.public.orders_enriched | t356 | 3 | 0.73 | 00:00:00.042878 | 00:00:00.207876 | 00:00:00.831505
materialize.public.orders_by_customer | t365 | 0 | 0.45 | 00:00:00.054026 | 00:00:00.120242 | 00:00:00.48097
(8 rows)
```
There is one row per worker per dataflow, sorted by ratio, so rows for
different objects interleave. A ratio near `1` means a worker is doing a
roughly average share of the work. Here `orders_enriched` has a worker at
`3.74` on a four-worker replica, close to the theoretical maximum of `4`: one
worker is doing nearly all of that dataflow's work.
> **Important:** `max_operator_cpu_ratio` is the maximum across all of a dataflow's operators, so
> a high ratio can come from an operator that contributes almost nothing to the
> dataflow's CPU time. Only act on a row whose `total_elapsed` is also
> significant.
Two further caveats:
- The numbers accumulate from the moment each dataflow was created, so a short
burst of skew in a long-running dataflow is diluted by its history. To
measure a window, sample twice and compare.
- On a cluster with many objects the output can run to thousands of rows. Use
[`EXPLAIN ANALYZE ... AS SQL`](/sql/explain-analyze/#explain-analyze--as-sql)
to get the underlying query, then filter and sort it yourself.
**Step 2. Localize the skew to an operator.** Drill into the object you
identified:
```mzsql
EXPLAIN ANALYZE CPU WITH SKEW FOR MATERIALIZED VIEW orders_enriched;
```
```nofmt
operator | worker_id | cpu_ratio | worker_elapsed | avg_elapsed | total_elapsed
-----------------------------+-----------+-----------+-----------------+-----------------+-----------------
Differential Join %0 » %1 | 0 | 0.08 | 00:00:00.006928 | 00:00:00.087401 | 00:00:00.349606
Differential Join %0 » %1 | 1 | 0.11 | 00:00:00.009606 | 00:00:00.087401 | 00:00:00.349606
Differential Join %0 » %1 | 2 | 3.73 | 00:00:00.326225 | 00:00:00.087401 | 00:00:00.349606
Differential Join %0 » %1 | 3 | 0.08 | 00:00:00.006846 | 00:00:00.087401 | 00:00:00.349606
Arrange (#0{customer_id}) | 0 | 0.77 | 00:00:00.002539 | 00:00:00.00329 | 00:00:00.01316
Arrange (#0{customer_id}) | 1 | 1.84 | 00:00:00.006057 | 00:00:00.00329 | 00:00:00.01316
Arrange (#0{customer_id}) | 2 | 0.65 | 00:00:00.002136 | 00:00:00.00329 | 00:00:00.01316
Arrange (#0{customer_id}) | 3 | 0.74 | 00:00:00.002426 | 00:00:00.00329 | 00:00:00.01316
Read u11 | | | | |
Arrange (#1{customer_id}) | 0 | 0.6 | 00:00:00.070684 | 00:00:00.117398 | 00:00:00.469594
Arrange (#1{customer_id}) | 1 | 0.15 | 00:00:00.017521 | 00:00:00.117398 | 00:00:00.469594
Arrange (#1{customer_id}) | 2 | 2.96 | 00:00:00.347571 | 00:00:00.117398 | 00:00:00.469594
Arrange (#1{customer_id}) | 3 | 0.29 | 00:00:00.033816 | 00:00:00.117398 | 00:00:00.469594
Read u10 | | | | |
(14 rows)
```
Use `FOR INDEX ` for an index. The operator with the highest
ratio, most often a `Join` or `Reduce`, is where the skew originates. Here it
is the join, and the arrangement it reads from names the offending key:
`customer_id`.
The per-object form reports `cpu_ratio` rather than the `max_operator_cpu_ratio`
of the cluster-wide form, since it is already per operator. Leaf `Read` rows
have no per-worker records of their own and report empty metrics.
**Step 3. Find the hot key.** A skewed `Join` or `Reduce` is almost always
caused by a **hot key**: one value in the join or `GROUP BY` column(s) accounts
for far more rows than the rest. Confirm it by counting rows per value:
```mzsql
SELECT customer_id, count(*) AS num_rows
FROM orders
GROUP BY customer_id
ORDER BY num_rows DESC
LIMIT 20;
```
```nofmt
customer_id | num_rows
-------------+----------
1 | 390000
1024 | 1
1280 | 1
1536 | 1
1792 | 1
2048 | 1
...
(20 rows)
```
A single value with an outsized count confirms the hot key. A common trigger is
an upstream change that collapses a once-diverse column to a single value or to
`NULL`. See [Is work distributed equally across
workers?](/transform-data/dataflow-troubleshooting/#is-work-distributed-equally-across-workers)
for other causes of skew, such as cross joins and
`ORDER BY`/`LIMIT`/`OFFSET` queries.
> **Note:** Not every plan shape skews on a hot key. `count` and `sum` plan as an
> accumulable reduce, whose cost barely depends on rows per key, and `min`/`max`
> over a non-monotonic input plans as a bucketed hierarchical reduce, which
> deliberately spreads one key across workers. Joins skew the hardest.
### Resolution
Restructure the query so the hot key's rows aren't concentrated on a single
worker, for example by pre-aggregating or filtering rows before the join, or by
adding a column to the key so that values spread across more workers.
If the skew can't be eliminated, size the cluster for the busiest worker's load
rather than the average, since the other workers won't absorb it.
### Prevention
- Key joins and aggregations on columns with high cardinality. A column that is
mostly one value, or mostly `NULL`, concentrates on one worker by
construction.
- Watch for upstream schema changes that collapse a once-diverse column to a
single value or to `NULL`. This is the most common way a healthy dataflow
becomes skewed without any change on the Materialize side.
- Test with data whose key distribution matches production. Skew is a property
of the data, not of the query, so uniformly distributed test data will not
reproduce it.
- Monitor per-worker CPU rather than the replica average, since `cpu_percent`
hides skew by construction.
## An expensive object
One dataflow can dominate a cluster's CPU without any skew: the work is spread
evenly across workers, there is just a lot of it.
### Diagnosing the issue
```mzsql
SET CLUSTER TO ;
EXPLAIN ANALYZE CLUSTER CPU;
```
```nofmt
object | global_id | total_elapsed
------------------------------------------+-----------+-----------------
materialize.public.orders_enriched | t356 | 00:00:00.832362
materialize.public.orders_by_customer | t365 | 00:00:00.482028
(2 rows)
```
The output is sorted by `total_elapsed`, so the objects at the top are the
cluster's most expensive dataflows. Drill into one with
`EXPLAIN ANALYZE CPU FOR MATERIALIZED VIEW ` to see its operators.
> **Note:** `total_elapsed` accumulates from the moment the dataflow was created, so a
> long-lived object can outrank one that is expensive *right now*. To see which
> operators are busy at this moment, use
> [`mz_compute_operator_durations_histogram`](/transform-data/dataflow-troubleshooting/#debugging-expensive-dataflows-and-operators).
### Resolution
[Optimize the expensive object](/transform-data/optimization/). Cross joins and
joins without a suitable index are the usual culprits. Alternatively, move the
object to its own cluster, or size the cluster up with
[`ALTER CLUSTER ... SET (SIZE = '')`](/sql/alter-cluster/).
### Prevention
- Review the plan of a new object with [`EXPLAIN
PLAN`](/sql/explain-plan/) before it reaches a production cluster, and check
that joins use an index on the join key.
- Keep unrelated expensive objects on separate clusters, so that one object's
cost cannot starve the others. See the [operational
guidelines](/clusters/operational-guidelines/).
## Hydration
Hydration is CPU-intensive: the replica reprocesses each object's inputs from
scratch. Any event that drops a replica's in-memory state re-runs that work, and
hydrating a new object on a busy cluster can saturate it outright.
### Diagnosing the issue
Check what is still hydrating, including sources and sinks:
```mzsql
SELECT o.name, h.replica_id
FROM mz_internal.mz_hydration_statuses h
JOIN mz_catalog.mz_objects o ON h.object_id = o.id
JOIN mz_catalog.mz_clusters c ON o.cluster_id = c.id
WHERE c.name = ''
AND NOT h.hydrated;
```
```nofmt
name | replica_id
--------+------------
big_mv |
(1 row)
```
Zero rows is the healthy steady state: everything on the cluster is hydrated.
A `NULL` `replica_id` means compute introspection has not reported on the object
yet, which is normal for an object that has only just been created.
### Resolution
Hydration resolves itself, so no action is needed unless it keeps recurring. If
it does, find what is triggering it:
- **Replica restarts**, including [OOM crash
loops](/transform-data/freshness-troubleshooting/#check-for-oom-crash-loops),
which rehydrate the whole cluster on every restart.
- **DDL or deploy activity**. Creating, altering, or dropping an object hydrates
it on whichever cluster it lives on. See [Check for DDL or deploy
activity](/transform-data/freshness-troubleshooting/#check-for-ddl-or-deploy-activity).
- **Cluster resizes**, which hydrate the new replicas before dropping the old
ones.
### Prevention
- Introduce new objects through a [blue/green
deployment](/developer-tools/dbt/blue-green-deployments/) rather than on a
live production cluster, so hydration happens on a cluster that is not
serving traffic.
- Size clusters so that they do not OOM, since an OOM crash loop rehydrates the
whole cluster on every restart.
- To shorten hydration without paying for a larger cluster continuously, use
[autoscaling](/clusters/autoscaling/).
## Ad-hoc query load
A cluster serves `SELECT`s from the same replicas that maintain its indexes and
materialized views, so query traffic and maintenance work compete for the same
CPU. A burst of queries, or a query that can't be answered from an index, shows
up as a cluster-wide spike. Client-side restart loops are a frequent cause: each
reconnect resubmits the same queries, and each one spins up a temporary
dataflow.
### Diagnosing the issue
```mzsql
SET CLUSTER TO ;
SELECT object_id, type, count(*) AS active_peeks
FROM mz_introspection.mz_active_peeks
GROUP BY object_id, type
ORDER BY active_peeks DESC;
```
```nofmt
object_id | type | active_peeks
-----------+-------+--------------
u9 | index | 2
t331 | index | 1
(2 rows)
```
A `u` prefix identifies a user object, here an index answering two reads. A `t`
prefix is a transient dataflow, built to answer a query that no existing
arrangement could serve. A steady supply of `t` rows means queries are paying to
build dataflows rather than reading from indexes.
This is a point-in-time snapshot of in-flight reads, so sample it repeatedly
during a spike. For the window after the fact, query
[`mz_internal.mz_recent_activity_log`](/sql/system-catalog/mz_internal/#mz_recent_activity_log)
instead.
### Resolution
Serve queries from a cluster separate from the one maintaining the objects, as
described in the [operational
guidelines](/clusters/operational-guidelines/#three-tier-architecture).
### Prevention
- Separate serving clusters from compute clusters from the start, so that a
burst of query traffic cannot delay maintenance work. Use [role-based access
control](/security/cloud/access-control/#role-based-access-control-rbac) to
keep ad-hoc queries off production compute clusters.
- Index the columns that ad-hoc queries filter on, so that a query is answered
from an existing arrangement instead of building a temporary dataflow. A view
that is queried repeatedly is cheaper as a materialized view than as an
ad-hoc `SELECT` over an unmaterialized one.
- Configure clients with backoff on reconnect, so that a client-side restart
loop does not multiply into repeated query bursts.
## Upstream data volume
A dataflow's steady-state CPU is proportional to the rate of change flowing
through it, not to the size of its inputs. A cluster that was comfortable can
saturate when an upstream system starts writing faster, with no change on the
Materialize side.
### Diagnosing the issue
If the cluster hosts sources, sample their counters twice a minute apart and
compare:
```mzsql
SELECT
s.name,
ss.messages_received,
ss.updates_committed
FROM mz_internal.mz_source_statistics ss
JOIN mz_catalog.mz_sources s ON ss.id = s.id
JOIN mz_catalog.mz_clusters c ON s.cluster_id = c.id
WHERE c.name = '';
```
```nofmt
name | messages_received | updates_committed
------+-------------------+-------------------
lg | 171 | 170
(1 row)
```
These counters are best-effort and only meaningful as rates; see [counter
metrics](/sql/system-catalog/mz_internal/#counter-metrics). Joining
`mz_catalog.mz_sources` restricts the result to top-level sources. To include
the tables created from a source, join `mz_catalog.mz_objects` instead.
### Resolution
If the rate is far above what the workload was sized for, either size the
cluster up or reduce the volume upstream.
If the sources live on a different cluster from the objects that spiked, check
that cluster too: downstream compute inherits its inputs' change rate. See
[Check source
ingestion](/transform-data/freshness-troubleshooting/#check-source-ingestion).
### Prevention
- Size clusters against the peak change rate rather than the average, and
revisit the sizing when upstream workloads change.
- [Monitor freshness](/transform-data/monitor-freshness/) so that a rising
change rate surfaces as lag before it surfaces as saturation.
## Memory pressure causing increased spill to disk
A replica that is close to its memory limit spills data to disk, and the
resulting paging registers as CPU time that isn't doing any of your work.
### Diagnosing the issue
Check the other columns of
[`mz_cluster_replica_utilization`](/sql/system-catalog/mz_internal/#mz_cluster_replica_utilization)
for the same window:
```mzsql
SELECT
r.name AS replica_name,
u.cpu_percent,
u.memory_percent,
u.disk_percent,
u.swap_percent
FROM mz_internal.mz_cluster_replica_utilization u
JOIN mz_catalog.mz_cluster_replicas r ON u.replica_id = r.id
JOIN mz_catalog.mz_clusters c ON r.cluster_id = c.id
WHERE c.name = '';
```
```nofmt
replica_name | cpu_percent | memory_percent | disk_percent | swap_percent
--------------+-------------+--------------------+--------------+--------------
r1 | 0.863405875 | 0.8431712962962964 | |
(1 row)
```
`disk_percent` and `swap_percent` are `NULL` when the replica reports no
corresponding limit, as above. A replica under memory pressure reports rising
values in both.
### Resolution
High `memory_percent` alongside rising `disk_percent` or `swap_percent` means
you are looking at a memory problem wearing a CPU costume. Size the cluster up,
or reduce the memory footprint of its objects.
### Prevention
- Alert on `memory_percent` as well as `cpu_percent`, so that memory pressure
is caught before it presents as a CPU anomaly.
- Reduce the memory footprint of expensive objects, for example by filtering
earlier in the dataflow or by reducing the number of arrangements. See
[optimization](/transform-data/optimization/).
## An undersized cluster
If CPU is spread evenly across workers with no recent hydration, DDL, or
upstream change, the cluster is undersized for its workload.
### Diagnosing the issue
To measure how much headroom is left, subscribe to the time workers spend idle.
`SUBSCRIBE` streams results, so wrap it in `COPY ... TO STDOUT` or a cursor;
a bare `SUBSCRIBE` prints nothing in `psql`.
```mzsql
SET CLUSTER TO ;
BEGIN;
DECLARE c CURSOR FOR SUBSCRIBE (
SELECT sum(slept_for_ns * count)
FROM mz_introspection.mz_scheduling_parks_histogram
);
FETCH 5 c WITH (timeout = '6s');
COMMIT;
```
```nofmt
mz_timestamp | mz_diff | sum
---------------+---------+---------------
1789489597053 | 1 | 1232890339840
1789489598000 | -1 | 1232890339840
1789489598000 | 1 | 1239430677504
1789489599000 | 1 | 1244927487744
1789489599000 | -1 | 1239430677504
(5 rows)
```
Each tick emits a retraction (`mz_diff = -1`) of the previous value and an
insertion (`mz_diff = 1`) of the new one.
The `sum` is **cumulative** parked nanoseconds across all of the replica's
workers, not a rate, so take the difference between two insertions to get the
idle time for that interval. Over a window of `T` seconds, a fully idle cluster
accrues `T × ` seconds of idle time. As a rule of thumb, a
cluster with healthy headroom stays above 10% of that.
[`mz_catalog.mz_cluster_replica_sizes`](/sql/system-catalog/mz_catalog/#mz_cluster_replica_sizes)
gives the worker count for a size.
Because this aggregates across workers, it will not reveal skew. Use it
alongside `EXPLAIN ANALYZE CLUSTER CPU`, not instead of it.
### Resolution
Size the cluster up with [`ALTER CLUSTER ... SET (SIZE = '')`](/sql/alter-cluster/) or move objects to another cluster.
> **Important:** Sizing up does not always reduce CPU. A cluster runs each object's operators on
> every worker, so the operator count grows with both the number of objects and
> the number of workers, and coordination overhead grows with it. A cluster that
> hosts many objects can therefore use *more* CPU after a resize.
> If freshness degrades and CPU rises after sizing up, the cluster is too large
> for its workload. Size back down, or split the objects across several smaller
> clusters.
### Prevention
- Track idle time continuously rather than sampling it during an incident, so
that shrinking headroom is visible before the cluster saturates.
- Size from the hydration peak. If CPU during hydration stayed well below the
replica's capacity, the cluster has room to shrink.
- Prefer several smaller clusters over one large one, particularly when hosting
many objects. Cross-cluster joins and strict serializability still hold.
- Follow the [operational guidelines](/clusters/operational-guidelines/) for
how to lay out clusters. See [Check cluster
health](/transform-data/freshness-troubleshooting/#check-cluster-health) for
the corresponding freshness symptoms.
---
## Troubleshoot clusters
If you're seeing unexpected cluster behavior, these guides can help you find
the cause:
- [Memory spikes](/clusters/troubleshoot-clusters/memory-spike/)